Keeping an eye on the performance of your applications is something that it easy to neglect. We all know that we should be regularly recording key performance indicators and regularly leaning on the profiler to spot dangers early, but how often is the dust actually blown off?
I’ve been doing a fair bit of performance monitoring work lately and thought it might be a good idea to capture a few thoughts.
Set up early
It’s probably a good move to setup performance measurement early. I’m usually interested in two areas, the real-time performance and the resource usage.
Performance
What you define as “performance” is completely down to you and your application. It may be in the request / response world, the time taken to process a request and return a response. It may reflect the ability to handle thousands of requests within a certain time (formalised as a service level agreement) or it may be around reliability and up time, scalability or accuracy.
Some things that are usually constant though are an emphasis on time, correctness and robustness of system under load. This is all about measurement and optimisation.
Response times - of your critical path
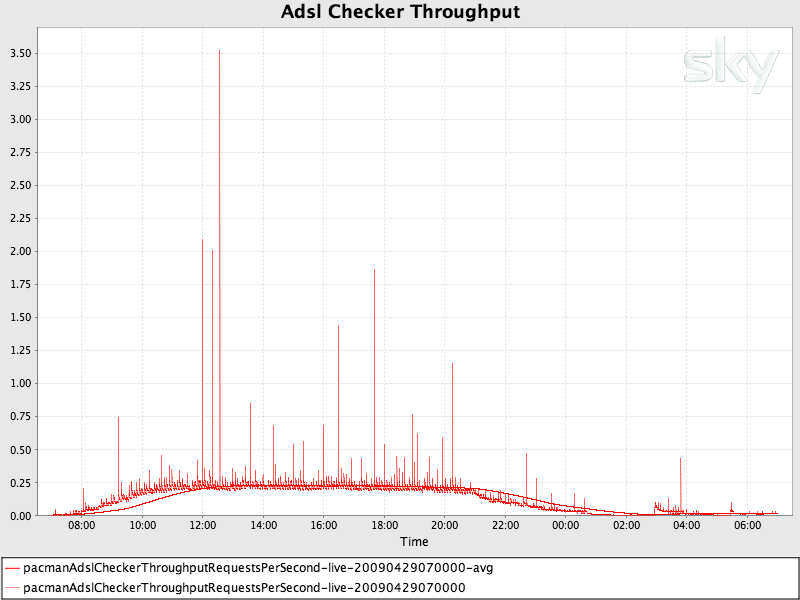
Throughput - typically the number of requests / transactions / operations per second
Load - the number of request / transactions / operations being observed.
Success / failure counts - it’s no good being quick if you’re always wrong
Garbage collection profile - you’ll probably be more interested in this if your system is already highly performant. In these cases you can potentially see dramatic differences in critical path processing times when excessive or inefficient GC is taking place. Tuning is a specialist skill, good luck. Google Sun’s G1 for renewed hope.

Resources
The section on resources is more open ended. By resources, I mean both hardware and software resources. Of course, taking into account the resource usage of interrelated external systems may also be of interest to the happy tuner and its all about avoiding resources starvation and spotting bottlenecks.
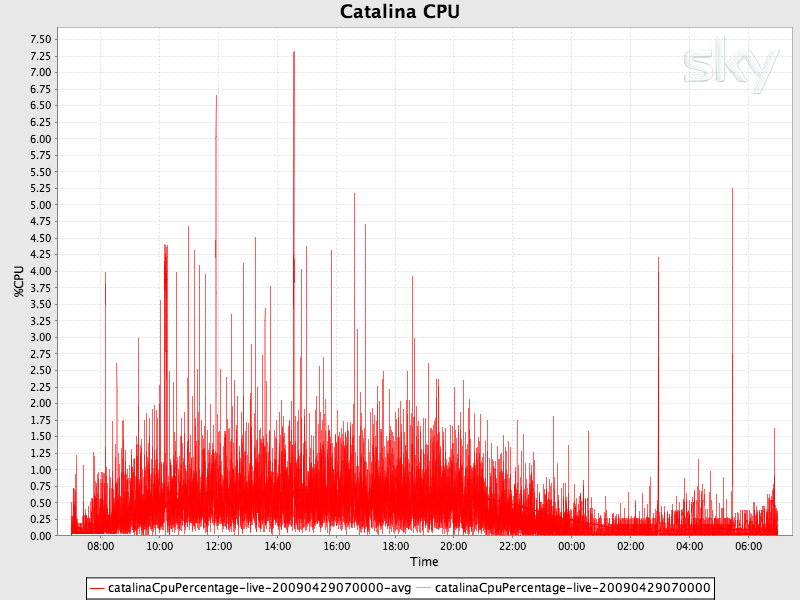
CPU - see the sidebar on the optimal number of threads
Memory - The JVM can theoretically allocate only 2GB to the heap on 32 bit machines and 16GB on 64 bit machines. In practice, hitting this upper bound with -Xmx can be tricky. Either way, you’ll want to understand the memory characteristics of your application and how it behaves if you start to reach the upper bound of the heap.
IO - I mean here things like handles, database connections, physical network connections and other tasty bites. Without these, all is lost and managing these to avoid resource starvation can be of primary importance.
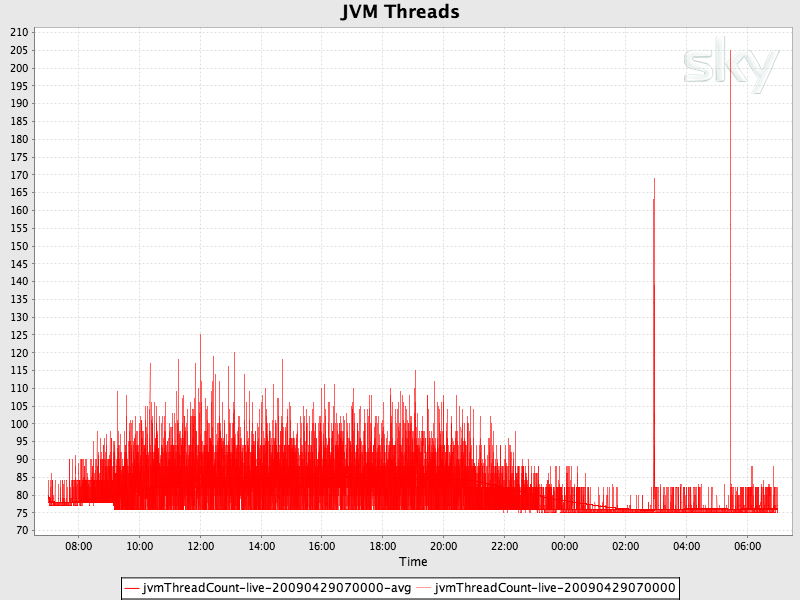
Threads - there is a relationship between the number of threads your software requires and hardware resources available to you, threads are not unbounded in your application so the prudent coder will seek insight into the affect creating lots of threads will have. See a previous post.
Statistic Gathering
Once we have an idea of what to measure, the next step is to think about how to capture and represent the raw data. We need to capture the raw data and turn it into information that’s actually useful. It’s all too easy to get information overload and more choosing what’s actually important can be tricky.
You could capture all the data about every single request but it’s unlikely that this is the information you’ll need without doing some form of manipulation. Instead, I prefer to capture information, manipulating and aggregating the data from each request as we go.
For example, typically you might be interested in the means, samples or percentile based information.
Mean values are probably the simplest to get started with, recording figures like mean response time are useful but don’t always offer the full picture. Average figures can be skewed by extreme results or extreme results may be lost in the mean. Supplementing with unmodified samples can help give a fuller picture.
Percentile based reporting gives more insight than a smoothed average figure. For example, if most of the requests are sub-second, it can be hard to spot the small number of slow requests. By reviewing at a particular percentile you can gain visibility of these and help determine what’s an acceptable level. For example, the mean response time at the 95th percentile will likely be noticeably different than the mean.
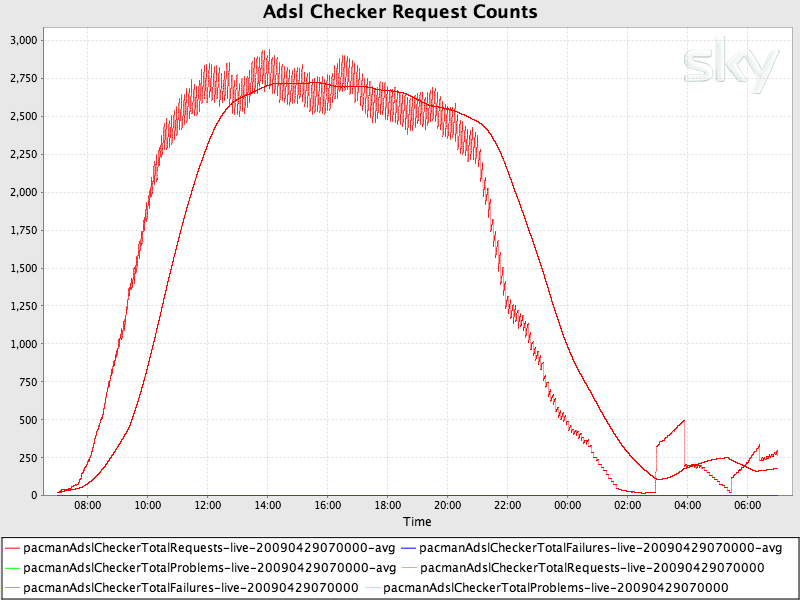
Another option is to implement a sliding view on the data. Here, you record information for, say, an hour and as time progresses beyond that hour, you start to loose past data and include new data. At most, an hour of data is available. This can be useful as rather than cumulative counts, the sliding window is visually more responsive to changes (in particular, drops). For example, once charted, a drop in a cumulative chart will show as a slow in accent of the series where with a sliding window chart, it will show as a clear drop.
This might give you results something like the image to the right. Without a sliding window, the request count would be cumulative.
Implementing
There’s plenty of ways to get statistics out of your application. Instrumenting the code at key points using decoration is a good option. Using something like AspectJ is another option and both free your code from any clutter that would otherwise pollute and distract from your classes real responsibilities. Logging is a good example of instrumentation polluting things. Typically, the act of logging has nothing to do with the role of the class doing the logging.
The instrumenting code will likely be modifying objects in memory that collect and manipulate the raw data. You’ll almost certainly want to make sure this memory object is thread safe and performant, it should be light weight and non-obtrusive.
What happens to the memory object is up to you, but you’ll need to output it for analysis at some point. I prefer to publish the objects via JMX, that way you can setup a separate ‘collector’ to periodically read the values and have it’s wicked way with them. With this approach, its even more important to keep the object lightweight - the MBean will always be in memory (the MBean server will see to this) and so if it contains rogue references to big objects, they’ll never get garbage collected. The other tip is to create one of these such objects per request type, don’t create a new one per request for example.