Blog
Man vs Model
Measuring AI-Assisted development against my historical productivity peaks
A four-week, AI-assisted delivery burst measured against my own historical peaks. What shipped, how I measured it, what the numbers really say, and the guardrails that made it safe.
Recently, I shipped an AI RAG Ghostwriter system plus CI, unit and visual tests for my blog, oh and migrated from Ruby (Octopress) to Astro static site generators. Something that I gave up doing manually about a year and a half ago. In just a few days of elapsed time.
It felt insanely productive. That initial migration I gave up on (moving one post at a time, converting one at a time) took me and AI about a day, elapsed time. About 200 posts plus glue and custom processing, styling and search.
Afterward, I was curious if that feeling of productivity was real, and if so, how much faster I was compared to my own historical peaks. So I set out to find out.
Turns out, with AI assistance I’ve been ~2.8x more productive than my historical peaks
Here’s the story.
The Question
Did AI meaningfully increase my throughput over a concentrated four-week window, compared to my own past peak periods?
Not lines of code but something more meaningful - delivered features and value-add.
Methodology
I wanted to measure initiatives and value, not commits or lines of code.
Something that’s a discrete, user-meaningful chunk of work that stands alone in production. An example might be adding a Cypress suite of visual regression tests rather than fixing a flaky test. Let’s call this an initiative.
In the end, I used two models.
- Delivery signals: FVI (
FeatureValueIndex) based on commit buckets and new files, weighted by feature-like, new code, new tests, and reliability work. - Initiative-sizing: FSS (
FeatureSizeScore), a more qualitative model scoring each initiative on a rubric of novelty, depth, breadth, hardening, and user impact then mapped to feature points (XS-XXL).
Model 1: Delivery Signals (FVI)
The historical data was processed to derive a FeatureValueIndex (FVI) on four dimensions: new features, new misc code, new tests, and reliability (hardening, CI, general scaffolding). The idea being group code changes and bias towards “features” or value-add. To avoid raw-LOC bias, each was weighted.
| Dimension | Weight | Meaning |
|---|---|---|
| Feature-like commits (F) | 45% | Most direct proxy for user-visible work |
| New code files (NC) | 25% | Captures structural expansion |
| New test files (NT) | 20% | Indicates operational hardening |
| Reliability/CI (R) | 10% | Signals production readiness |
Each component is normalized to the maximum observed value across the compared repositories.
Model 2: Initiative-sizing (FSS)
As before, using historical data to derive a FeatureSizeScore (FSS) on five dimensions: novelty, depth, breadth, hardening, and user impact. Each scored 1-5 and weighted to reflect my values (novelty and depth matter more than breadth, which matters more than hardening, which matters more than user impact).
This model measures productivity by sizing initiatives, similar to story points (aka fairy points) designed to look past just delivery signals. Instead of counting commits, it measures how big the shipped capabilities were. Commit messages and code diffs were analysed using semantic reasoning and bucketed.
| Dimension | Weight | Meaning |
|---|---|---|
| Novel Capability (N) | 30% | Is this something fundamentally new? |
| Technical Depth (D) | 25% | Architectural or algorithmic complexity |
| Surface Breadth (B) | 20% | How much of the system it touches |
| Operational Hardening (O) | 15% | Tests, CI, packaging, release readiness |
| User/Product Impact (U) | 10% | Visible value to users |
I then mapped the composite score to a Feature Point (FP) size (XS-XXL) to make it more intuitive and to reflect the fact that a new subsystem is much bigger than a minor tweak.
| FSS Range | Size | Feature Points |
|---|---|---|
| ≥ 85 | XXL | 13 |
| 70–84 | XL | 8 |
| 55–69 | L | 5 |
| 40–54 | M | 3 |
| 25–39 | S | 2 |
| < 25 | XS | 1 |
Total productivity for the window is then the sum of the initiative sizes. This model is more subjective but tries to capture the real value and effort behind the work, not just the raw code churn.
TotalFeaturePoints = sum(FP for all initiatives)
As an example, having run the numbers, the following came out. It felt about right, a balance of volume and value.
| Initiative | Size |
|---|---|
| Ghostwriter | XXL (13 FP) |
| RAG retrieval | XXL (13 FP) |
| CI/test hardening | XL (8 FP) |
| UX improvements | L (5 FP) |
| SEO + analytics | L (5 FP) |
FVI asks:
How much delivery activity occurred?
FSS/FP asks:
How large were the things that were shipped?
Case Study
I compared the recent burst of activity in my blog against 28 days of historic activity across four other projects. I programmatically found busy periods in each. All metrics were derived directly from repository commit history for the time periods below.
| Repo | Window |
|---|---|
blog | 2026-02-08 to 2026-03-07 |
simple-excel | 2012-08-25 to 2012-09-21 |
tempus-fugit | 2009-11-30 to 2009-12-27 |
temperature-machine | 2018-04-12 to 2018-05-09 |
radiate | 2013-07-24 to 2013-08-20 |
No “10x developer” nonsense. Just like‑for‑like, same engineer, just younger.
Why these? From trawling the commits, GitHub stars and activity on my projects, these were some of my best and busiest projects and months I was “on it.”
During this time, the historical-me was passionate about code craft and quality. I would labour over design decisions and build complex systems that would be low-maintenance and high quality.
Recent me is much more “vibe” coding. I’ve focused a lot on organisational leadership in my more recent career, running a large team and setting the same standards at the org level that I was practising passionately in these historical peak periods. I just don’t have the time to code with the same laboured idealism.
Recent AI‑Assisted Burst
In terms of what I’m comparing against, what I actually delivered in the blog project included:
- Implementing a full RAG-based Ghostwriter pipeline that drafts long‑form content in my voice via OpenAI
- CI that evaluates drafts using style checks, broken‑link scans, and content linting.
- Visual regression tests on the rendered site to catch layout drift before publish.
- Lightweight RAG index (FAISS) over past posts and a style profile to ground the drafts.
- Reproducible prompts, fixtures, and an evaluation harness that blocks merges if scores regress.
The AI approach I took to create these was great at breadth and speed. My time went on shaping, joining, hardening and waiting around for multiple prompt threads to complete.
Results
All charts are generated directly from the commit history of the repositories listed below.
Delivery Signals (FVI) Raw Data
| Repo | Commits | New Files | New Code Files | New Test Files | Feature-like Commits | Fix-like Commits | Reliability/CI/test Commits |
|---|---|---|---|---|---|---|---|
blog | 196 | 225 | 52 | 116 | 61 | 51 | 57 |
simple-excel | 105 | 78 | 57 | 36 | 37 | 25 | 28 |
tempus-fugit | 76 | 40 | 31 | 19 | 30 | 9 | 16 |
temperature-machine | 126 | 25 | 3 | 6 | 17 | 10 | 10 |
radiate | 146 | 125 | 96 | 18 | 44 | 26 | 39 |
Delivery Signal (FVI) Makeup
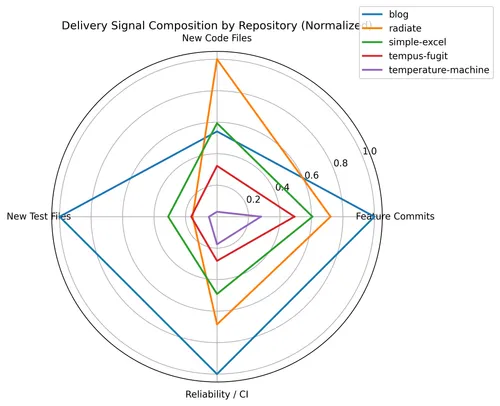
This radar chart shows the composition of delivery signals across repositories. This reveals the shape of delivery. The recent blog activity shows strong expansion in tests and reliability scaffolding, reflecting the AI workflow where scaffolding, evaluation harnesses, and guardrails were generated rapidly and then hardened.
FVI Totals (for the month)
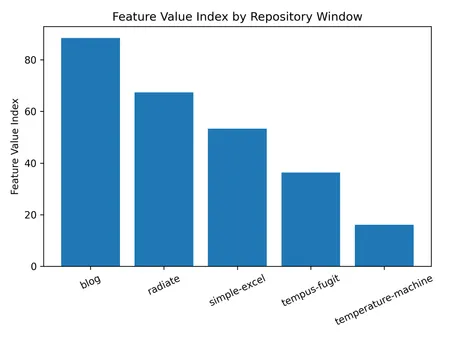
| Repo | FeatureValueIndex |
|---|---|
blog | 88.5 |
radiate | 67.4 |
simple-excel | 53.3 |
tempus-fugit | 36.3 |
temperature-machine | 16.1 |
The recent AI-assisted burst clearly exceeds my historical peaks, with the blog window achieving the highest composite delivery signal across feature commits, new code, tests, and reliability work.
Relative Performance vs Historical Peaks (FVI)
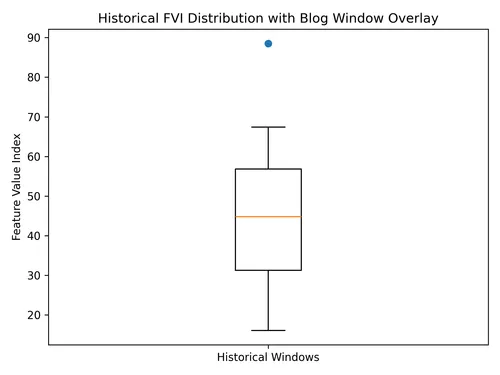
To make the comparison clearer, I divided the recent blog FVI score by several historical reference points. FeatureValueIndex for the AI-assisted month was 88.5, compared to a historical average of ~43.
- vs historical mean: 2.05x
- vs historical median: 1.98x
- vs best historical window (
radiate): 1.31x
In other words:
- this is about twice the delivery activity of my typical historical peak (when using AI)
- and ~30% more than my strongest previous month
The box-and-whisker plot shows the distribution of those historical windows. The AI-assisted window sits above that range, suggesting this wasn’t just a good month — it was outside the productivity band I normally operated in.
Initiative-sizing (FSS) Raw Data
While FVI measures delivery signals, the second model measures initiative magnitude.
Instead of counting commits or files, the Feature Size model groups work into initiatives and scores their size using the weighted rubric described earlier. Each initiative maps to a Feature Point (FP) size ranging from XS to XXL.
| Repo | Total Feature Points | # Initiatives | Avg FP / Initiative |
|---|---|---|---|
blog | 44 | 5 | 8.8 |
radiate | 21 | 4 | 5.3 |
simple-excel | 18 | 4 | 4.5 |
tempus-fugit | 14 | 3 | 4.7 |
temperature-machine | 9 | 3 | 3.0 |
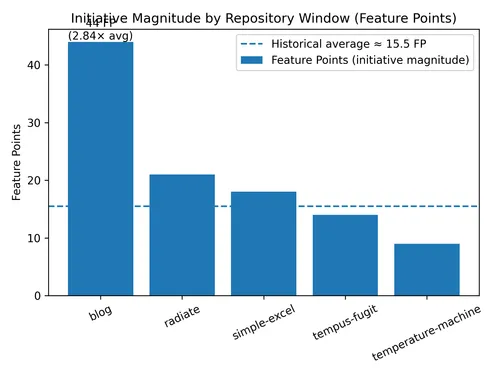
The recent blog window totals 44 Feature Points, compared to a historical average of 15.5.
Initiative Size Compared to Historical Peaks (FSS)
The following multipliers come from comparing the recent window’s Feature Point total (44) against historical reference points from above.
The historical average was therefore:
(21 + 18 + 14 + 9) / 4 = 15.5
Comparing the recent window:
- vs historical average: 2.84x
- vs best historical window (
radiate): 2.10x
In other words, the AI-assisted month did not just produce more delivery activity (as measured by FVI). It also produced significantly larger initiatives.
This is visible in the initiative breakdown:
| Initiative | Size |
|---|---|
| Ghostwriter | XXL (13 FP) |
| RAG retrieval | XXL (13 FP) |
| CI/test hardening | XL (8 FP) |
| UX improvements | L (5 FP) |
| SEO + analytics | L (5 FP) |
Two things stand out. First, the window stacked two XXL initiatives in the same month: the Ghostwriter platform and the semantic retrieval architecture. Second, supporting work (tests, CI, and UX) still landed as meaningful initiatives rather than incremental tweaks.
Compare that historically where my peak months tended to focus on one major capability axis at a time: API design, UI behaviour, packaging, or infrastructure hardening.
This AI-assisted month combined all of them simultaneously:
- new product capability
- architectural subsystems
- reliability scaffolding
- distribution and UX improvements
The result isn’t just higher delivery signals (the FVI result earlier) but larger capability steps shipped in the same period.
FVI and FSS/FP Combined
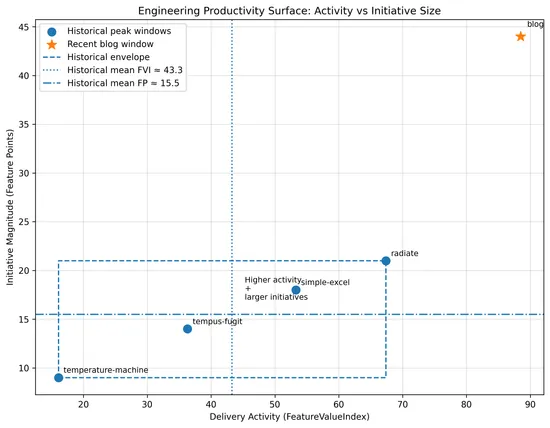
This chart combines both productivity models in one view.
- X-axis: delivery activity (FVI)
- Y-axis: initiative magnitude (Feature Points)
Historical windows cluster within a narrow band of activity and initiative size. The AI-assisted window shifts both right (more delivery) and up (larger initiatives).
This suggests the productivity gain is not just faster coding, but an expanded engineering capability surface, enabling multiple architectural initiatives to ship concurrently.
Something Surprising
Taking a step back from the headline numbers, I realised there was something interesting hiding in the data: the real productivity gain probably wasn’t 2x or 2.8x - it was closer to 6x.
It only becomes visible if we compute a third derived metric from these two models.
The Derived Model: Delivery Leverage Index (DLI)
The first two models measure different axes:
| Model | Measures |
|---|---|
| Feature Value Index (FVI) | delivery activity |
| Feature Points (FP) | initiative size |
If both increased simultaneously, perhaps the real change is multiplicative, not additive.
So we define:
Where:
Step 1 — Relative Delivery Signal
From the FVI model:
So:
Step 2 — Relative Initiative-sizing
From the FSS/FP model:
So:
Step 3 — Delivery Leverage Index
Now combine them.
So the effective productivity leverage becomes:
~5.8x vs historical baseline
Why this Happens
AI changes two things simultaneously: local coding throughput and the cognitive load of running multiple initiatives at once.
More commits, more tests, more scaffolding. Measured by FVI (~2x).
When cognitive load reduces, larger systems become feasible to build concurrently. Measured by Feature Points (~2.8x).
In this window, I shipped two XXL initiatives at once in the blog work: an entire Ghostwriter system and a semantic retrieval model.
I was working concurrently and often spinning up side quests (I even had my AI assistant generate a LaTeX Astro component to display these formulas whilst I was writing this post!).
The Key Insight
Empirically, from my own work, before AI, I was working on 1 large initiative + maintenance work.
With AI, it shifted to 2-3 large initiatives + maintenance + reliability work + side quests.
What this Actually Means
Before I jump both feet first into the hype machine, this doesn’t mean developers are 6x faster at coding. It means the effective capability surface per engineer expands dramatically.
A useful interpretation:
| Layer | Effect |
|---|---|
| Coding | ~2x faster |
| Architecture execution | ~3x larger |
| Overall delivery capacity | ~5–6x |
Two different measurement models produced similar results.
A delivery-signal model suggests roughly 2x higher engineering throughput.
A capability-sizing model suggests roughly 2.8x larger initiatives shipped.
When those two effects combine, the effective delivery leverage during this period was closer to 5–6x my historical baseline.
Bonus Insight
For the AI burst, I created 116 test files. Compared to historical windows where I was always focused on test-driven development, this was proportionally much higher than the historical average. For example, in radiate I created 18 test files, in simple-excel 36, and in tempus-fugit 19.
| Repo | New test files |
|---|---|
| blog | 116 |
| radiate | 18 |
| simple-excel | 36 |
| tempus-fugit | 19 |
| temperature-machine | 6 |
So the AI era produced 3–6x more reliability scaffolding. I think this was because I was driving. I asked for additional tests and test scaffolding because it was so easy, especially when having agents generate them in parallel.
This is important because it might counter the typical criticism: “AI just produces low-quality code faster”, at least when the pilot is actually concerned about testing.
Man vs Model?
Across a month, my AI-assisted self out-shipped my historical peaks by ~2.7–2.8x on an initiative-weighted basis.
That advantage existed because I paired generation with hardening and governance. Without tests, CI, and reproducible evaluation, you get speed without confidence, which is just future work with interest.
It didn’t replace expertise. It amplified it, especially on repeatable patterns and breadth tasks.
Over to you…
What did AI actually add to your last month?
If you’ve measured at the initiative level, I’d love to hear your experience, where it helped, and where it got in the way. If you haven’t, pick your next two initiatives, measure, and tell me what you see.